Zoom In, Zoom Out in the Complex IS
 Zoom In,Zoom Outin theComplex IS
- Why a “high level” <> “granular” mapping of an Information System?

2 technical biases:- This mapping must be dynamic , and reflect the exact reality of the system at time “t”.
- This mapping must be technical, not declarative : it will be based on real processes, that is to say the continuous analysis of flows (procedural code, ETL/ELT, ESB, transformation in the data visualization layer, etc.), and the analysis of certain logs to know the uses of the information.
- 1 - A “High Level” mapping of the IS
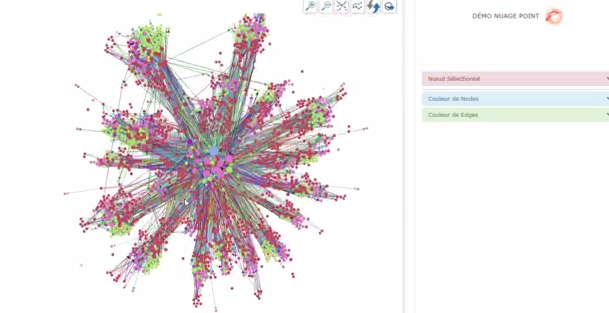
- This representation allows us to understand the importance of each “data point”: where are the strategic zones in an IS , the “hot” zones, the “cold” zones, the main “information highways” between the large groups of the IF, and conversely , the dependencies do not exist.Some statistics help IS architects to make an objective diagnosis of the state of their system, and to deploy action plans to reach their targets.
- 2 - First zoom: complete flows, anduses of information
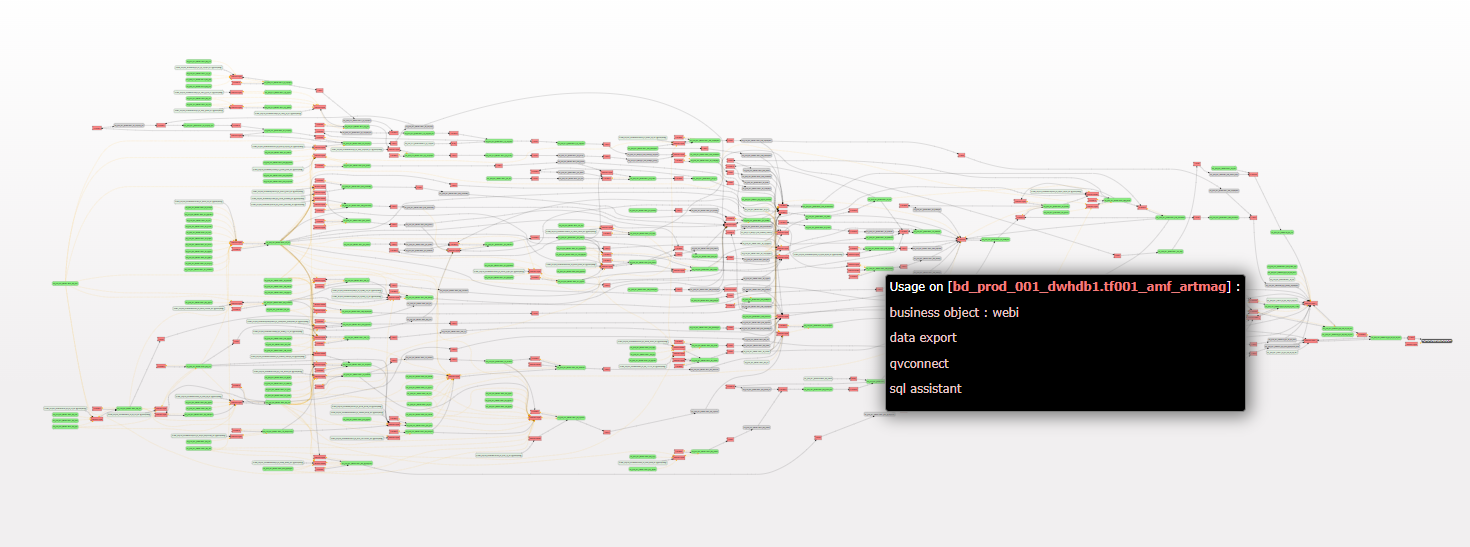
- This representation allows you to visually discover how the information has moved/transformed. By choosing 2 “data points” (table, fields, etc.) from the IS, potentially very distant, all intermediate transformations are highlighted.This vision will allow data engineering teams to have a simple and factual view of complete flows in 2 mouse clicks, whether they are on their infrastructure, in the Cloud, or both.
- 3 - Second zoom: a granular representationflows and their uses through data lineage
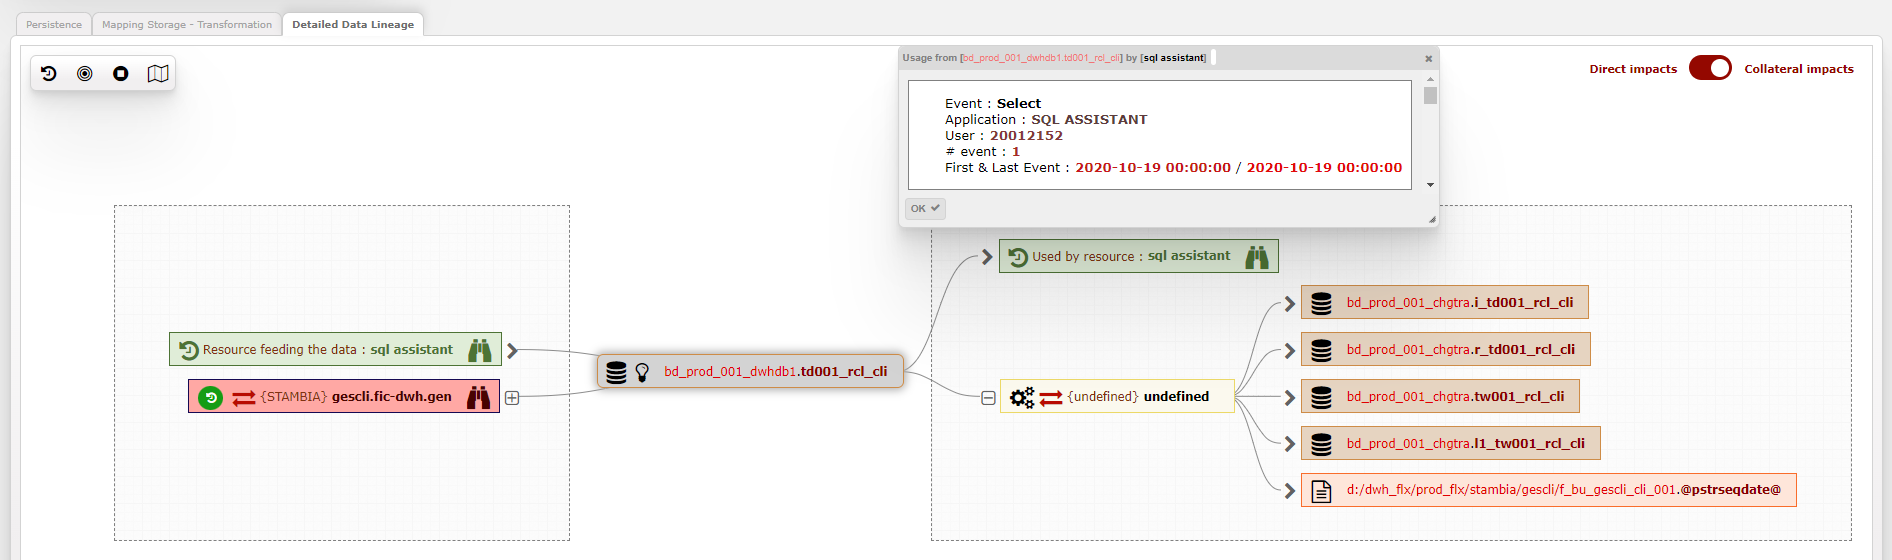
- This representation, a real granular “data lineage”, allows, starting from a “data point” (table, file, fields), to unfold the flows in all directions, whatever the data transformation technology, to know the sources or final targets (uses), the underlying code, the execution dates, and any useful technical details.
The data engineer teams will be able to carry out impact analysis, resolve problems with chains that are slow or inoperative, too complex, etc. - Thus, it is possible to have 3 types of mapping of an information system with variable granularity, and with bridges from one to the other.This will allow different but complementary approaches to continually improve IS governance.
www.ellipsys-lab.com
contact@ellipsys-lab.com


Commentaires
Enregistrer un commentaire